
Energy intensity
Global energy intensity declined by 1% in 2024, slower than its 2010-2019 average and insufficient to meet the 2°C pathway.
96%
Iran’s energy intensity is nearly twice higher than the global average (in 2024).
Global energy intensity declined by 1% in 2024, slower than its 2010-2019 average and insufficient to meet the 2°C pathway.
Global energy intensity (total energy consumption per unit of GDP) dipped by 1% in 2024, i.e., slower than its historical 2%/year decline over 2010-2019. This downward trend is related to the higher share of renewables in power generation and efficiency gains but it remains very insufficient compared with the over 3.5%/year decrease required to achieve the 2°C scenario.
In the BRICS, which accounted for 43% of the primary energy consumption in 2024, energy intensity decreased by nearly 2% in 2024 but remained 27% higher than the world average. It declined by 1% in China – a slower pace than over 2010-2019 in China, remaining 35% above the global average – and by 2% in India (in line with its historical trend and 5% below the global average in 2024). Improvements were faster in Russia (-2%) but slower in South Africa (-1%, where it remained 53% above the global average). There was no improvement in Brazil, whose energy intensity has remained broadly stable since 2000.
In OECD countries, where the energy intensity is 26% lower than the global average, the continuing growth of renewable power generation contributed to reduce energy intensity by 1% though at a slower pace than over the 2010-2019 period (-2%/year). Improvements slowed down in the EU (-1.5%), the US (-2%), and Japan (-1%). They were also limited in South Korea, in the Pacific, in Africa, and in the Middle East.
Breakdown by country (koe/$15p)
World
Trend over 1990 - 2024 - koe/$15p
Our 2025 edition of Global Energy Trends presents insights on essential energy data.
We have contextualised these findings against long-term climate targets :
- Which must accelerate their efforts to meet 2050 targets?
- What are the underlying drivers explaining why Europe is struggling to achieve the Paris Agreement objectives?
- Which regions are making substantial contributions to climate mitigation?
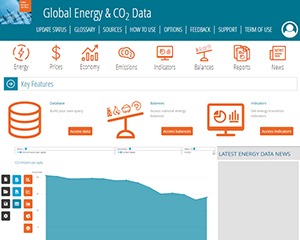
Need more data? All the information presented in this energy data tool are extracted from Global Energy & CO2 Data service, the most comprehensive and up-to-date database on supply, demand, prices, indicators, and emissions, per energy sources.
Discover this serviceCopyright © Enerdata 2009 - 2025 All rights reserved - Terms and Conditions - Cookies management
The Enerdata Yearbook is a proprietary application. Neither the Yearbook nor its integrated data set (be it in the form of raw data or derived data) shall be distributed, published, or sold.


