
CO2 intensity
Global CO2 intensity declined by 2.9% in 2025, faster than over the 2010-2019 period.
-41%
Decrease in China’s CO2 intensity between 2010 and 2025, close to the EU average.
Global CO2 intensity declined by 2.9% in 2025, faster than over the 2010-2019 period.
In 2025, the global CO2 intensity (CO2 emissions per unit of GDP at constant purchasing power parity) declined by 2.9%, faster than its average 2.2%/year decline over the 2010-2019 period. In 2025, it stood 27% below its 2010 level.
This decrease is due to strong decreases in China (-5%) and India (-7%) as both countries stabilised CO2 emissions thanks to soaring solar and wind generation and as China’s industry reoriented towards less CO2-intensive, high added-value high-tech branches. However, their CO2 intensity remains significantly higher than the global average (+56% and +13%, respectively).
CO2 intensity declined in most countries, with some major exceptions, as the United States (+1%) and Canada (+2%), where fossil fuel consumption grew faster than the GDP (mainly for power generation in the USA and for transports in Canada). In Brazil, higher fossil fuel consumption in the power sector and rebounding transport emissions also raised CO2 intensity (+1%).
Higher renewable power generation contributed to cut the CO2 intensity in Europe (-2%), Japan (-3%), South Korea (-2%), and Australia (-4%). It also decreased in Saudi Arabia (-5%), in South Africa (-2%), in Russia (-2%), in Mexico and in Indonesia.
Breakdown by country (kCO2/$15p)
World
Trend over 1990 - 2025 - kCO2/$15p
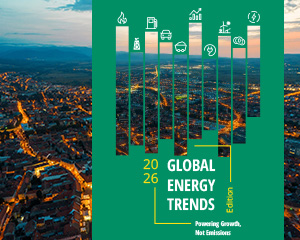
Powering Growth, Not Emissions
Global growth returns to pre-crisis patterns—but emissions are not decreasing fast enough for climate goals. As renewables surge and electricity demand accelerates, fossil fuels remain dominant. Discover the key trends reshaping energy and decarbonisation across the G20 in 2025.
Download the publication
Need more data? All the information presented in this energy data tool are extracted from Global Energy & CO2 Data service, the most comprehensive and up-to-date database on all CO2 emissions from fuel combustion by sector and sources, industrial process, waste, but also on CH4, N2O, PFC, SF6 emissions. Detailed indicators are available by country and by sector.
Discover this serviceCopyright © Enerdata 2009 - 2026 All rights reserved - Terms and Conditions - Cookies management
The Enerdata Yearbook is a proprietary application. Neither the Yearbook nor its integrated data set (be it in the form of raw data or derived data) shall be distributed, published, or sold.


