
Average CO2 emission factor
In 2025, the global carbon factor is still close to its 2010 level, further away from the 2°C pathway.
-45%
Denmark’s carbon factor has fallen by 45% since 2010 and is now 40% below the global average.
In 2025, the global carbon factor is still close to its 2010 level, further away from the 2°C pathway.
The global carbon factor (CO2 emissions/primary energy consumption) rebounded in 2025 (+1.5%). It has remained broadly stable since 2010, declining by less than 4% over the last 15 years, since fossil fuels still cover most of the global energy mix. This trend remains insufficient to reach the 2°C pathway that would require a much faster reduction (over 3%/year).
In 2025, the carbon factor declined in China (-3%), India, Japan (-1% each), and Australia (-2%), thanks to a rising CO2-free power generation that helped cut fossil fuel consumption. It also decreased in Indonesia, Mexico, Saudi Arabia (-1% each), whereas it remained stable in the EU, Russia, and South Africa. It even increased in North America (around 1% each for the USA and Canada over higher use of fossil fuels), in Brazil, and South Korea (+1%).
Breakdown by country (tCO2/toe)
World
Trend over 1990 - 2025 - tCO2/toe
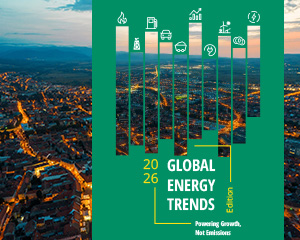
Powering Growth, Not Emissions
Global growth returns to pre-crisis patterns—but emissions are not decreasing fast enough for climate goals. As renewables surge and electricity demand accelerates, fossil fuels remain dominant. Discover the key trends reshaping energy and decarbonisation across the G20 in 2025.
Download the publication
Need more data? All the information presented in this energy data tool are extracted from Global Energy & CO2 Data service, the most comprehensive and up-to-date database on all CO2 emissions from fuel combustion by sector and sources, industrial process, waste, but also on CH4, N2O, PFC, SF6 emissions. Detailed indicators are available by country and by sector.
Discover this serviceCopyright © Enerdata 2009 - 2026 All rights reserved - Terms and Conditions - Cookies management
The Enerdata Yearbook is a proprietary application. Neither the Yearbook nor its integrated data set (be it in the form of raw data or derived data) shall be distributed, published, or sold.


