
The US’s net gas exports surged by 28% in 2025.
Breakdown by country (bcm)
World
Breakdown by region (2025) - bcm
Breakdown by energy (2025) - Mtoe
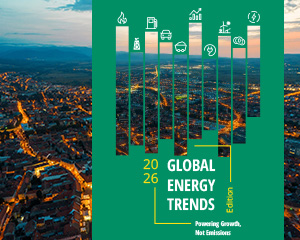
Powering Growth, Not Emissions
Global growth returns to pre-crisis patterns—but emissions are not decreasing fast enough for climate goals. As renewables surge and electricity demand accelerates, fossil fuels remain dominant. Discover the key trends reshaping energy and decarbonisation across the G20 in 2025.
Download the publication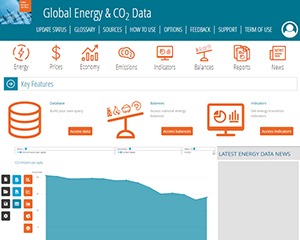
Need more data? All the information presented in this energy data tool are extracted from Global Energy & CO2 Data service, the most comprehensive and up-to-date database on all gas states and sources: natural, manufactured and LNG. Access to the whole gas value chain information: reserves, production, trade, LNG liquefaction capacities, prices, consumption per sector and indicators.
Discover this serviceCopyright © Enerdata 2009 - 2026 All rights reserved - Terms and Conditions - Cookies management
The Enerdata Yearbook is a proprietary application. Neither the Yearbook nor its integrated data set (be it in the form of raw data or derived data) shall be distributed, published, or sold.


