The COP28 Global Pledge on Renewable Energy and Energy Efficiency
THE COP28 PLEDGE ON RENEWABLES AND ENERGY EFFICIENCY
During COP28, 120 countries pledged to triple renewable capacity and reach 11,000 GW, and double the pace at which global energy efficiency improves on average, from 2%/year to 4%, by 2030. We explore how much of a shift this would represent compared to recent trends.
Evolution of global renewable power capacity since 1990
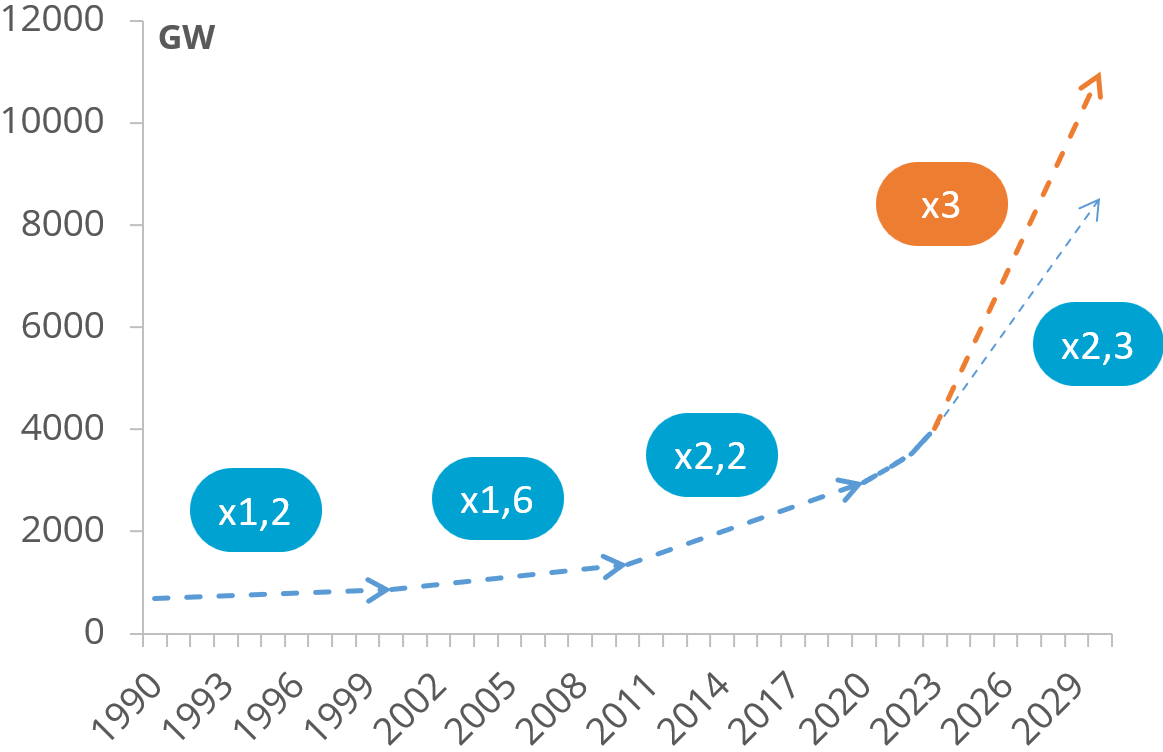
While the development of renewables has been accelerating, especially since 2010. The beginning of the 2020 decade has seen a small upgrade (+11%/year vs. 8%/year in 2010-2020) yet tripling renewable capacity would require a much more important boost (around +16%/year).
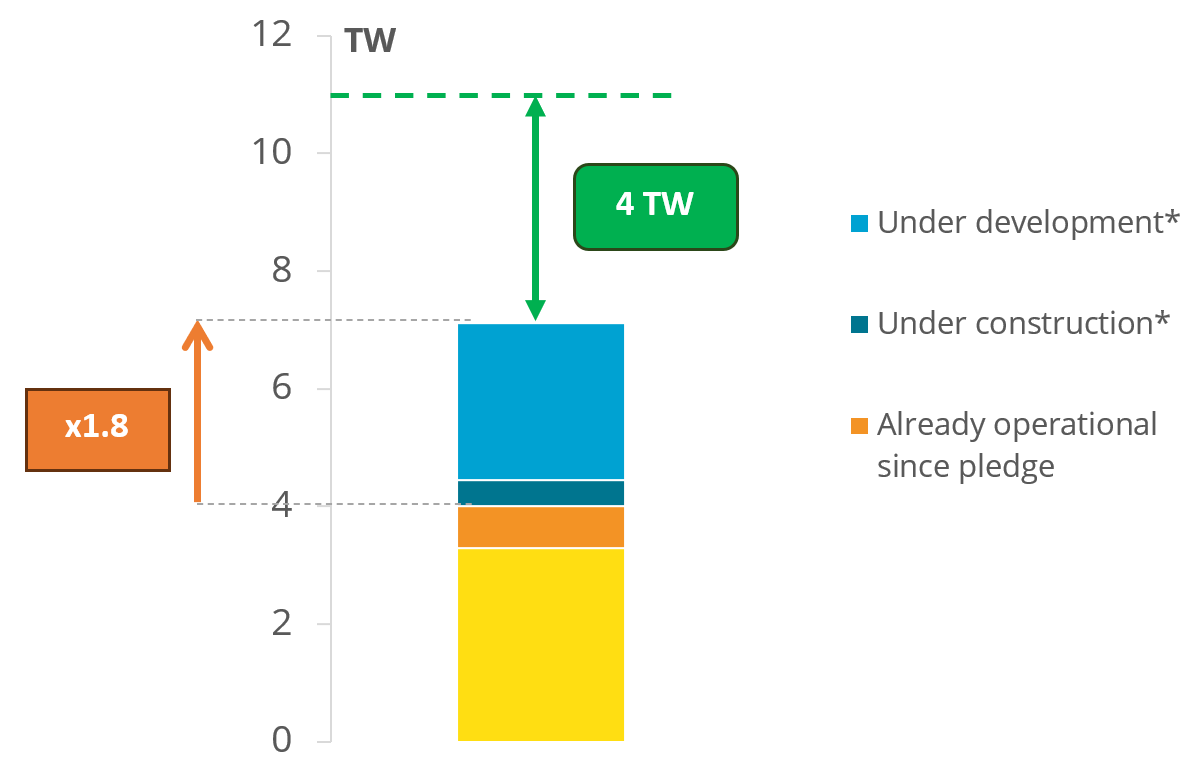
Among projects currently under construction and at other less advanced stages of development, respectively 53% and 67% are renewables (against 45% in currently operating capacity). This means that there is a shift towards renewables, but there will still be a significant share of fossil fuels in the future power generation mix.
Assuming these projects go all the way through commissioning by 2030, there would still be 4 TW missing (i.e. the current global capacity of renewables). Thus massive new investments are still required.
Global renewable capacity in operation and in project as of 2024
The proposed target of increasing the pace at which energy efficiency increases up to 4%/year refers more specifically to energy intensity. While energy efficiency can be measured at a micro scale, through the relation between energy consumption and a given output (industrial goods produced, energy service provided, distance travelled, etc.), at a macroeconomic level, wider activity indicators are used (e.g. GDP) and the notion of energy intensity becomes more appropriate. Energy intensity reflects not only energy efficiency progress, but also potential structural effects that affect the relation between activity and energy consumption.
Energy Intensity of G20 countries
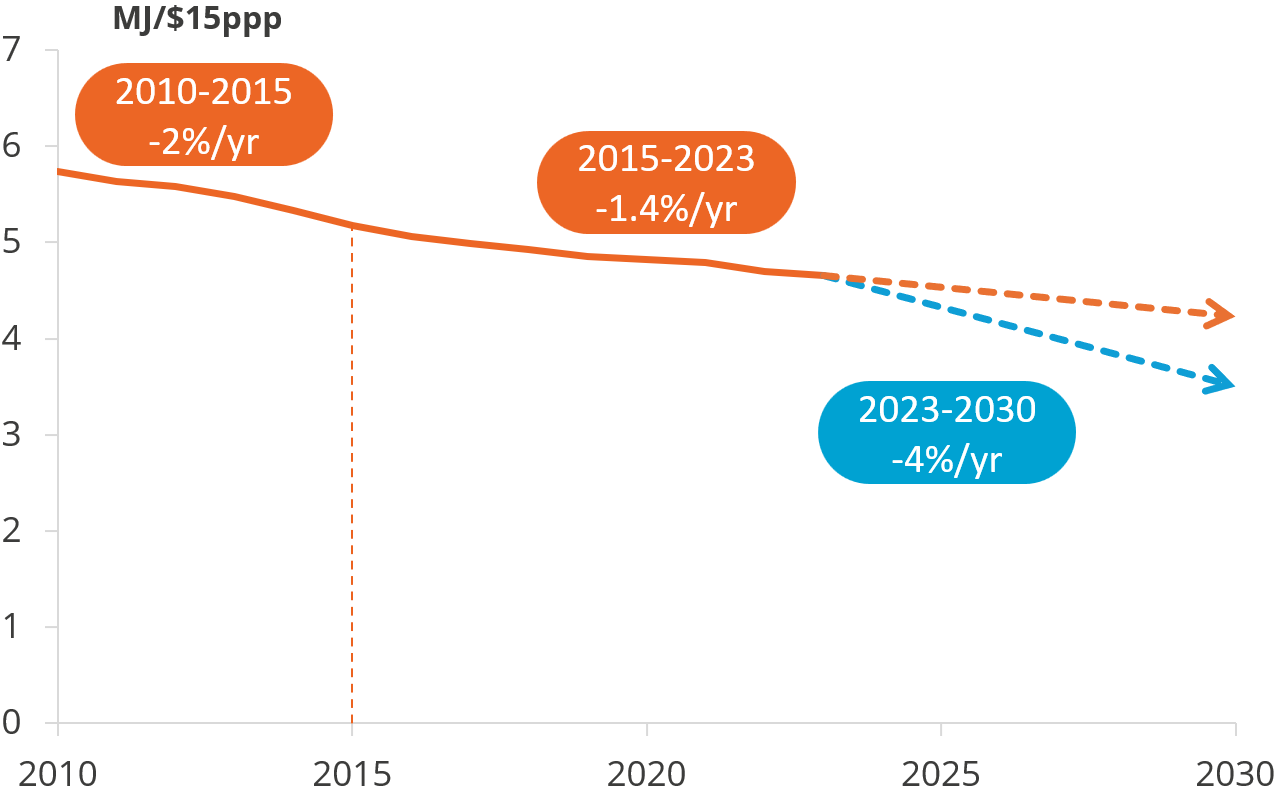
Historically, energy intensity has decreased by 1.7%/year between 2010 and 2022. However, since the Paris Agreement, the pace has been slower, thus an average decrease of 4%/year represents an even bigger shift than what the pledge suggests.
The object relies on an expectedly significant rollout of technological “game-changers” and other disruptive options which could introduce a major shift in energy efficiency, such as electric vehicles in transport, heat pumps for heating uses (space and water heating in buildings, low-temperature heating in industry). However, so far, while EVs have known an impressive development (multiplied by 40 since 2015, 20% of sales in 2023), they still weigh very little in the transport sector as a whole. Indeed, EVs only account for 3% of the total car stock in 2023, and electricity represents a mere 1.4% of total energy consumption in transport (vs. 0.9% in 2015).
Overall the COP28 pledge is an ambitious one, especially compared to historical trends but most importantly the objectives stated are not sufficient in themselves to meaningfully tackle climate change. Historically, renewables have only added to fossil fuels rather than substituting them, and energy efficiency progress failed to compensate for the increase in activity. Therefore energy consumption and related GHG emissions have continued to increase.
A consistent decarbonization pathway must also address activity through e.g. energy sufficiency, circularity and modal shifts in order to mitigate the dependency towards uncertain technological progress and deployment as well as limited resources.
Our 2024 edition of Global Energy Trends presents insights on essential energy data and evaluates the COP28 pledge to determine if current trends support the tripling of renewable capacity and the doubling of energy efficiency by 2030.
Download the publicationAccess to the most comprehensive and up-to-date database on energy supply, demand, prices and GHG emissions (186 countries).
Discover this service
