Total energy consumption
Global energy consumption grew by 2.2% in 2024, faster than over 2010-2019.
+4%
Strong increase in China’s energy consumption, now accounting for 27% of the global energy consumption.
Global energy consumption grew by 2.2% in 2024, faster than over 2010-2019.
Global energy consumption increased by 2.2% in 2024, faster than its historical 2010-2019 trend (+1.5%/year), especially in the BRICS (+3%), which accounted for 43% of the global energy consumption in 2024 and posted a strong economic growth. The growth was particularly rapid in China (+4%, back to its 2010-2019 average after a 7% rebound in 2023), India (+5%, as over 2010-2019), Indonesia (+6%, twice its historical rate), Vietnam (+9%), Russia (+2%), and Brazil (+3%).
Meanwhile, energy consumption grew at a slower rate in OECD countries (+1%, on average), with very different trends, amidst moderate or slow economic growth. It increased in the United States (+1%), in South Korea (+2%), in Australia (+1%) and Türkiye (+6%), whereas it remained stable in the EU, Mexico and Canada, and dipped by 1% in Japan. It slightly grew in the Middle East (5% growth in Iran partly offset by a 1% reduction in Saudi Arabia) and rose by 2.5% in Africa (+5% growth in Egypt).
Breakdown by country (Mtoe)
World
Trend over 1990 - 2024 - Mtoe
Breakdown by energy (2024) - Mtoe
Our 2025 edition of Global Energy Trends presents insights on essential energy data.
We have contextualised these findings against long-term climate targets :
- Which must accelerate their efforts to meet 2050 targets?
- What are the underlying drivers explaining why Europe is struggling to achieve the Paris Agreement objectives?
- Which regions are making substantial contributions to climate mitigation?
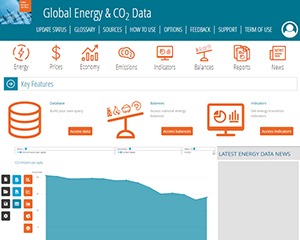
Need more data? All the information presented in this energy data tool are extracted from Global Energy & CO2 Data service, the most comprehensive and up-to-date database on supply, demand, prices, indicators, and emissions, per energy sources.
Discover this service


