
Share of wind and solar in electricity production
The share of wind and solar grew again in 2024 (+1.5 pp) to 15%.
70%
Share of solar and wind in Denmark’s power mix (from 20% in 2010).
The share of wind and solar grew again in 2024 (+1.5 pp) to 15%.
In 2024, global renewable installation reached new records, with over 450 GW of new solar capacity and over 110 GW of new wind capacity. China accounted for over 60% of these renewable installations, with 278 GW of new solar capacity and 80 GW of new wind capacity. Renewable installations were also steady in the EU (though slowing down), the US, and India.
Globally, the share of wind and solar in power generation rose by 1.5 pp in 2024 to 15% (nearly +13 pp since 2010). It increased by 3 pp to 18% in China (+16 pp since 2010) and by 2 pp to 17% in the USA (+14 pp since 2010). In the EU, the share of wind and solar in the power mix grew by 1 pp in 2024 to 28% (+22 pp since 2010), with particularly high levels in the Netherlands (+4 pp in 2024 to 45%), Denmark (+2 pp to a record of 70%).
Outside these three main markets, wind and solar covered around 35% of the UK’s power mix (+2 pp in 2024, 32 pp more than in 2010), 34% in Chile (+3 pp in 2024, +33 pp since 2010), 30% in New Zealand (+4 pp in 2024), 29% in Australia (+2 pp) and 24% in Brazil (+3 pp). Despite rising installations (over 24 GW of solar and 3.4 GW of wind in 2024), the share of renewables in the Indian power mix only grew by 1 pp to 12% (+10 pp since 2010). Wind and solar remained marginal in Africa (6%, including 8% in South Africa (stable in 2024), in the CIS (2%, including less than 1% in Russia and 5% in Kazakhstan), and in the Middle East (2%, despite a rising renewable generation in the United Arab Emirates).
Breakdown by country (%)
World
Trend over 1990 - 2024 - %
% in electricity production (2024) - %
Our 2025 edition of Global Energy Trends presents insights on essential energy data.
We have contextualised these findings against long-term climate targets :
- Which must accelerate their efforts to meet 2050 targets?
- What are the underlying drivers explaining why Europe is struggling to achieve the Paris Agreement objectives?
- Which regions are making substantial contributions to climate mitigation?
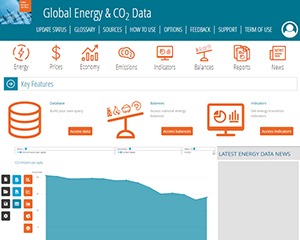
Need more data? All the information presented in this energy data tool are extracted from Global Energy & CO2 Data service, the most comprehensive and up-to-date database on all renewable resources: hydro, wind, solar, geothermal and biomass. Access to the whole renewable value chain information: renewable energy production capacities by technology, power generation by technology, biomass, biofuels, and indicators.
Discover this serviceCopyright © Enerdata 2009 - 2026 All rights reserved - Terms and Conditions - Cookies management
The Enerdata Yearbook is a proprietary application. Neither the Yearbook nor its integrated data set (be it in the form of raw data or derived data) shall be distributed, published, or sold.


